
What is PIInneh
Know when your reason to own a stock breaks.
PIInneh tracks the thesis behind every stock you follow, rates every company with the model that fits it, and measures value, diversification and crisis risk, with the evidence behind every number.
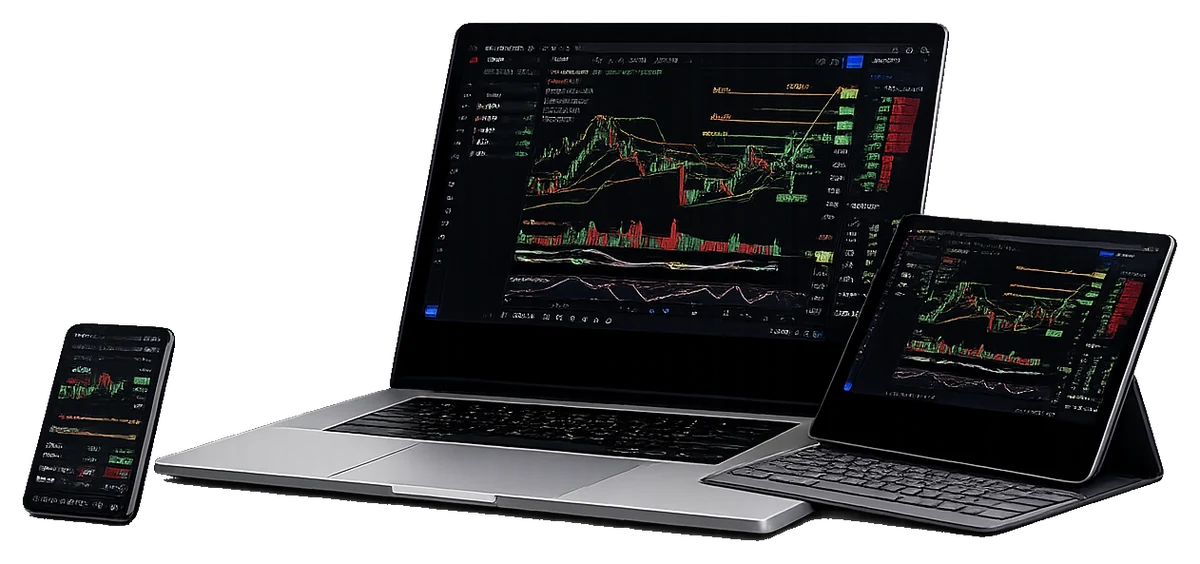
Preview edition: the figures across the site are sample data until live market data is connected.
What PIInneh does
How PIInneh works with live market data connected. In this preview edition, the figures on the site are sample data.
Your thesis, tracked.
Tell us why you own a stock, or start from our standard thesis. After every close we check each condition, show how far the price is from breaking it, and keep a dated, sealed record of every change.
The right model for every company.
Every company is rated on the π scale with the model that fits it: forensic accounting and distress tests for operating companies, Merton distance-to-default for financial companies, and DDBio cash runway for biotechnology companies.
Price against value.
Every stock is measured against its PIInneh intrinsic value, with the margin of safety and the model behind it, and against the latest annual and quarterly estimates: what was raised, what was cut, and by how much.
Diversification you can measure.
Our correlation analysis shows which holdings move together and which truly spread your risk. Across every sector, the Correlation Lab builds the minimum-variance, maximum-Sharpe and most diversified portfolios, and finds the best hedge for each holding.
Indices built on the market you can actually buy.
Our 11 PIInneh Quant indices use our own method, Active Floating Market Cap Weighted + 10% Cap. Each company is weighted by the portion of its float actively available to investors, not by its size alone, and no company may exceed 10% of an index.
Stress-tested before the market is.
Every index and every watchlist is run through 2008, the Dot-Com crash, a credit freeze and eight more Black Swan scenarios, so you see the damage before it happens.
How PIInneh is different
With live market data connected.
| The problem | What PIInneh does about it |
|---|---|
| One rating model applied to every company | The right model for each sector: Altman Z for operating companies, Merton for financial companies, DDBio for biotechnology |
| Signals without a record you can check | Every call dated and graded, misses included |
| Ratings without the evidence behind them | An evidence trail and a fingerprint behind every figure |
| Indices weighted by company size | Active Floating Market Cap Weighted + 10% Cap |
| A thesis you track by hand | Every condition checked after every close, with the distance to a break |
| Separate tools for each task | Ratings, signals, indices, correlation, projections and reports in one framework |
From data to decision
- 1
Data
Prices, financial statements and estimates, after every close once live data is connected
- 2
Models
The right distress model, value and estimates for each company
- 3
Signals
Five separately calculated methods, each with its record
- 4
Your thesis
Conditions checked, distance to a break, a sealed history
- 5
Decision
One report with the evidence, printable and exportable
A record you can check
Every signal and every call PIInneh makes is dated when it is issued, graded against what the price did next, and kept on the record, including the calls that were wrong, so you can see how often each method has been right before you rely on it. In this preview edition the record is simulated from sample data; real calls are stored and graded from the day live data is connected.
What we will never do
- We never sell ratings. No company can pay for a rating, a placement or a higher score.
- We never sell your data. Your watchlist, theses and decisions are not sold or shared.
- We never promise returns. We show evidence and probabilities; the decisions stay yours.
- We never hide our misses. Every graded call stays on the record, right or wrong.
Frequently asked questions
Who is PIInneh for?
Asset managers, hedge funds, financial advisers and individual investors. Each gets the same evidence: the rating and the model behind it, the signals and their record, the thesis and how far it is from breaking.
Is PIInneh investment advice?
No. Ratings, signals, projections and reports are analytical outputs of PIInneh’s methodology, not recommendations to buy, sell or hold any security. PIInneh LLC is not a registered investment adviser or broker-dealer. The decisions stay yours.
Is PIInneh live yet?
Not yet. This is a preview edition: every page works, but its figures are sample data. Ratings, signals, intrinsic values and track records are generated to show what the outputs look like, and index weights use market capitalization with the 10% cap until float data is connected. Live market data and accounts come next.
How often is the data updated?
PIInneh is built on end-of-day data. Once live data is connected, ratings, signals, theses, probabilities and index figures are recalculated after every close, and every report names the close it was computed on.
Is my watchlist private?
Yes. Today your watchlist, theses, decisions, alerts and report settings are kept in your own browser, on your own device. They are not sent to PIInneh. The research assistant (AI) is switched off; before it is switched on, the privacy policy will say what it sends and where. See our privacy policy.
Which companies are covered?
π ratings cover 3,930 companies; the Correlation Lab measures correlation across thousands of listed companies; signals, thesis tracking and decision reports cover the companies in the Signals universe; and the 11 PIInneh Quant indices each publish their full constituents.
How is a π rating made?
With the model that fits the company: Altman Z with four companion models for operating companies, Merton distance to default for financial companies, and DDBio cash runway for biotechnology companies. The methodology explains each one.
Why PIInneh
Investment research is fragmented and costly, spread across separate tools and manual work. PIInneh brings those capabilities together in one shared analytical framework and replaces guesswork with evidence you can trace, on a private AI that keeps your work your own.
PIInneh is built on end-of-day data: once live data is connected, ratings, signals, theses and index figures are recalculated after every close. Until then, the figures on this site are sample data.
Request early access
PIInneh is opening to its first users. Tell us who you are and how you would use it, and we will be in touch as places open.
We use your email only to reply and to manage early access. See our privacy policy.