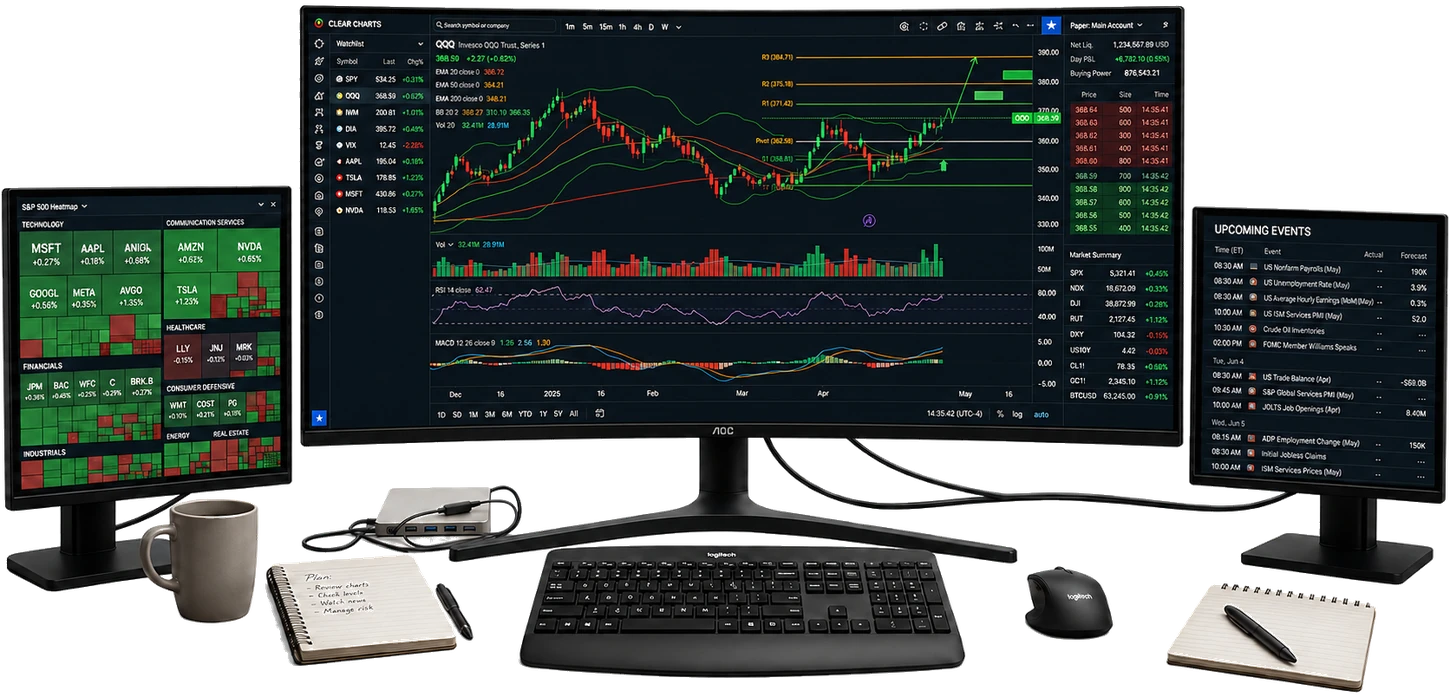
PIInneh tracks the thesis behind every stock you follow, rates every company with the model that fits it, and measures value, diversification and crisis risk, with the evidence behind every number.
PIInneh combines quantitative methods, fundamental analysis, liquidity filters, growth-qualification screens, Altman Z-score analysis, Merton distance-to-default modeling, and correlation- and liquidity-aware index construction into one clean forensic layer.
Then rank whatsurvives.
Research
Macro, industry and company research powered by proprietary and external data.
Quant Methods
Systematic models extract momentum, value, quality and sentiment signals.
Forensic Risk
Forensic accounting analysis and anomaly detection to uncover hidden risks.
Index & Rating Decision
Integrate signals, risk and growth scores, least correlated into index construction and rating decision.
Price the pipeline, not the promise.
Biotech Valuation
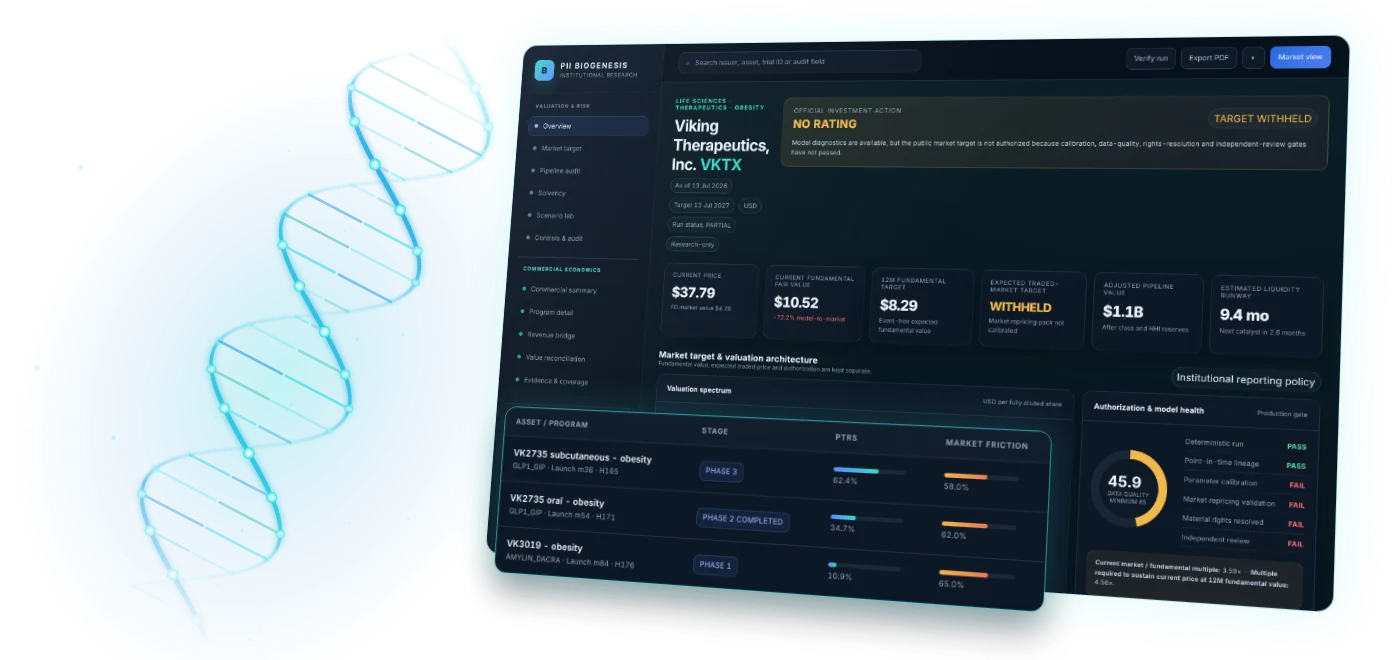
PIInneh values each biotech program from probability of success, patient funnel, pricing and access through peak revenue to risk-adjusted NPV. It stress-tests cash runway and catalysts, and withholds any target until every authorization gate passes.
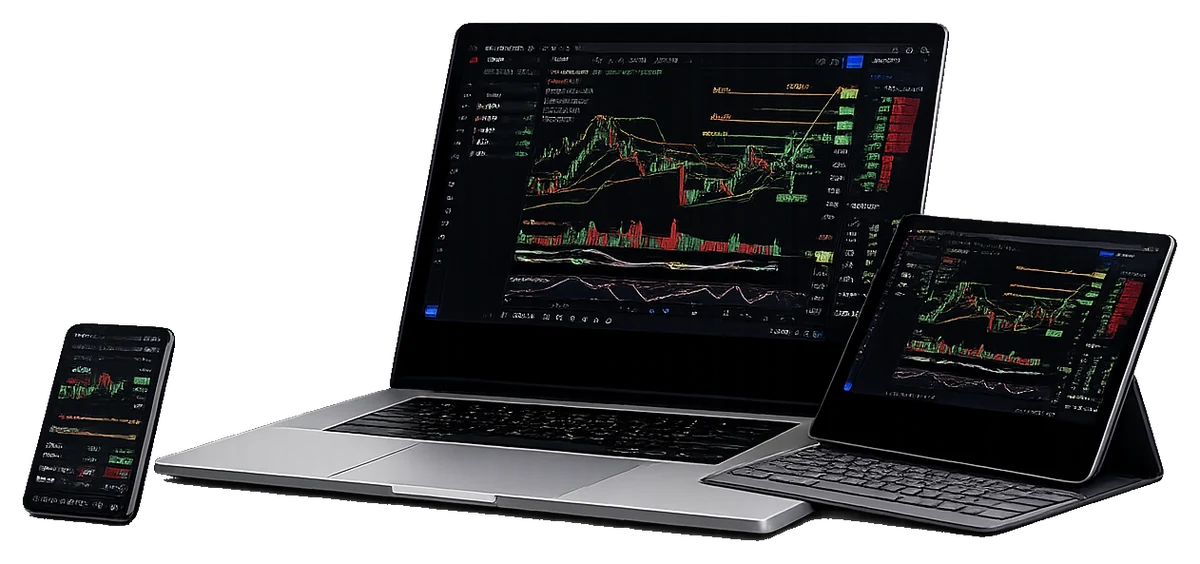
Cross-Device WorkspaceResearch, screen, and act seamlessly across devices.
Quant ScreeningRank opportunities by what survives.
Your thesis, tracked.
Tell us why you own a stock, or start from our standard thesis. After every close we check each condition, show how far the price is from breaking it, and keep a dated, sealed record of every change.
Every company is rated on the π scale with the model that fits it: forensic accounting and distress tests for operating companies, Merton distance-to-default for financial companies, and DDBio cash runway for biotechnology companies.
Every stock is measured against its PIInneh intrinsic value, with the margin of safety and the model behind it, and against the latest annual and quarterly estimates: what was raised, what was cut, and by how much.
Our correlation analysis shows which holdings move together and which truly spread your risk. Across every sector, the Correlation Lab builds the minimum-variance, maximum-Sharpe and most diversified portfolios, and finds the best hedge for each holding.
Our 11 PIInneh Quant indices use our own method, Active Floating Market Cap Weighted + 10% Cap. Each company is weighted by the portion of its float actively available to investors, not by its size alone, and no company may exceed 10% of an index.
Every index and every watchlist is run through 2008, the Dot-Com crash, a credit freeze and eight more Black Swan scenarios, so you see the damage before it happens.
Five independent methods are read after every close: forensic ratings, Superradiance trend, earnings estimates, price against value, and insider activity. Each signal shows how many of the five agree, and how often that method’s past calls on the stock proved right.
For any stock, one page answers seven questions: why own it, what it is worth, what would break it, how likely that is, what a crisis would do, who agrees, and what to watch next. Print it, take it to Excel, or record what you decided and why.
Biotechnology companies are valued program by program, from the probability of success, the patient funnel, pricing and access, through to risk-adjusted value. Cash runway and upcoming trial readouts are checked after every close.
Ready-made screens find quality at a fair price, companies drifting toward distress, deep value that isn’t broken, and hedges for your portfolio, each with the evidence behind every result. A screener that builds your selection into minimum-variance and tangency portfolios.
See where the price is likely to go, and how sure the model is. PIInneh combines 144 technical indicators and 25 factors from the Factor Zoo, spanning quant, fundamental and macro data, into a single price projection. Machine learning weighs each one by how well it has predicted this stock and limits those that repeat one another.
Machine-learning models forecast what drives the business; accounting rules then build revenue, earnings, cash-flow and balance-sheet projections that tie together, each with a low and a high case. Every estimate is shown against analyst consensus, revisions are tracked after every close, and each projection becomes an intrinsic value per share with the model that fits the company.
Research today is fragmented across tools that don’t talk to each other and models that don’t fit the company. PIInneh replaces guesswork with evidence you can trace, on a private AI that keeps your work your own.
MICROSOFT CORPORATION (MSFT)A Global Leader in Software, Services, Devices, and SolutionsFounded: 1975, Headquartered: Redmond, WAOperating Segments:– Productivity & Processes: Offers Microsoft 365, Teams, CoPilot, Windows commercial on-premises, Office services, LinkedIn, and Dynamics CRM/ERP applications.– Intelligent Cloud: Provides Azure and other cloud services, GitHub, and Nuance Healthcare.– Personal Computing: Delivers Windows OEM licensing, Surface devices, Xbox gaming services/hardware, Bing search, and advertising.Channels: Sells through OEMs, distributors, resellers, and online/retail stores.Collab: Mayo Clinic partnership for frontier AI in healthcare.